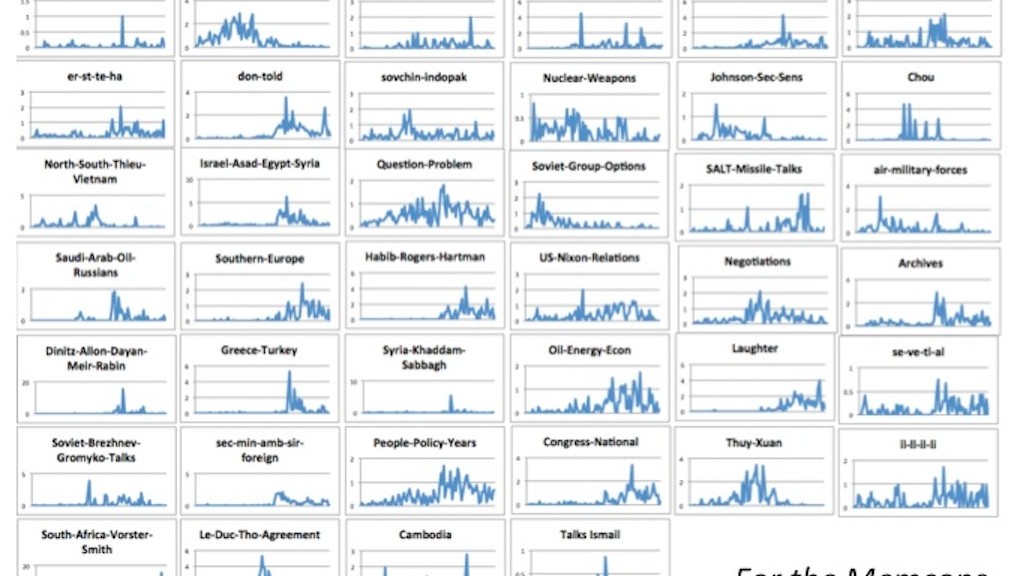
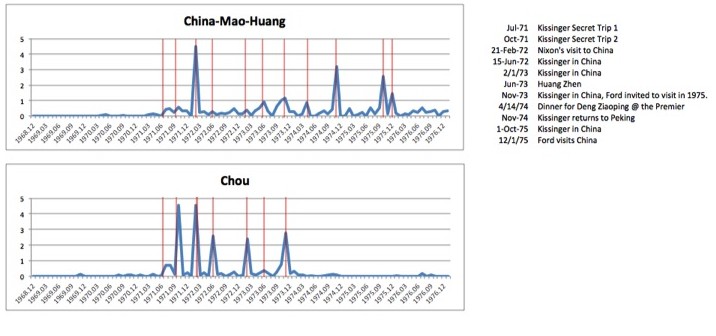
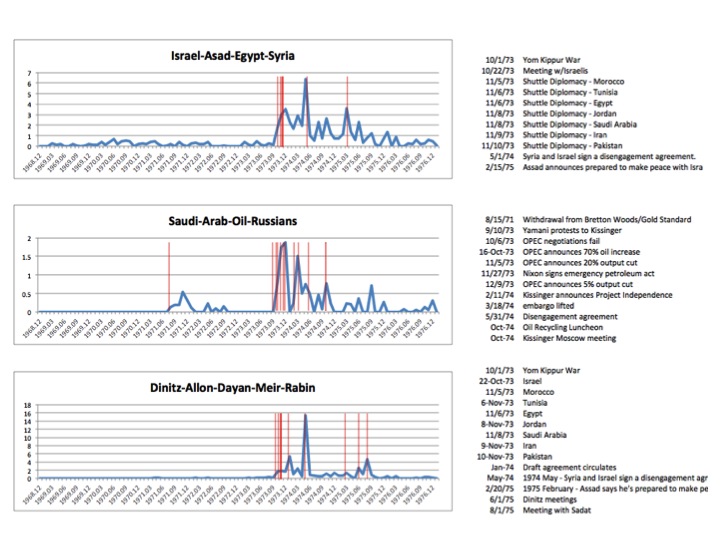
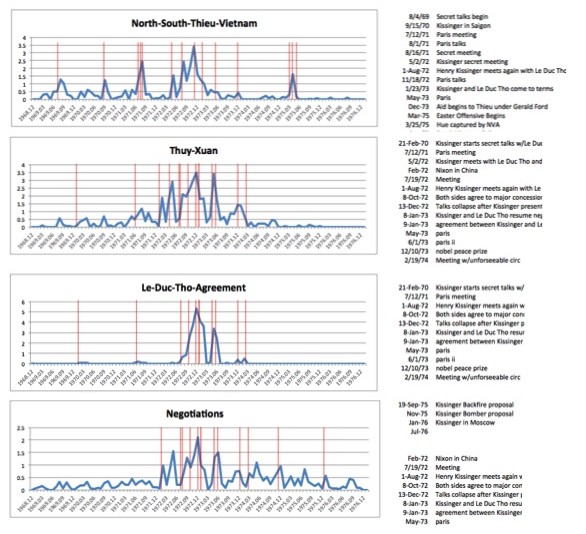
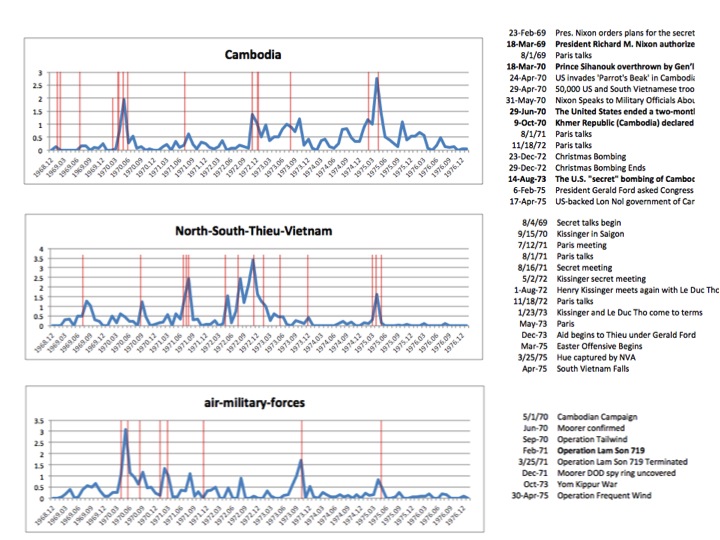
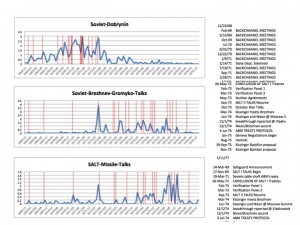
These graph thumbnails and closeups detail the topic weighting for a specific topic of the 40 topics in the topic model, each laid out on a timeline. The red lines represent selected historical events (listed in the sidebar to the right of the graph) displayed on the timeline for comparison to the changing topic data.
Memcons Topic Model Thumbnails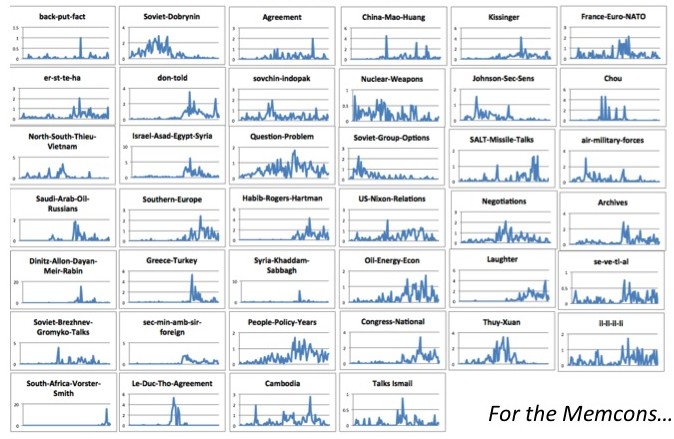
Telcons Topic Model Thumbnails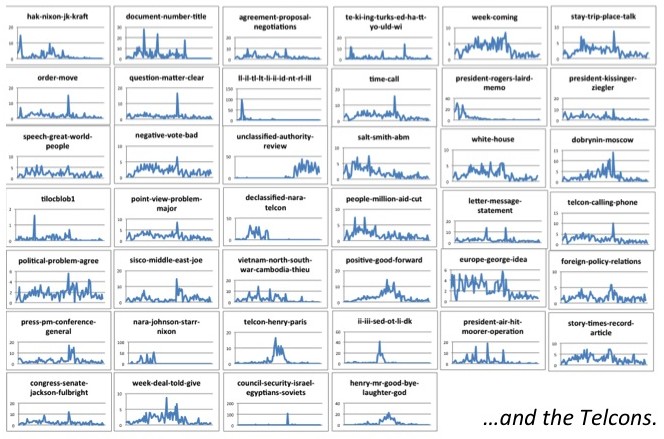
Detailed Timeline – Memcons ‘Cambodia’ Topic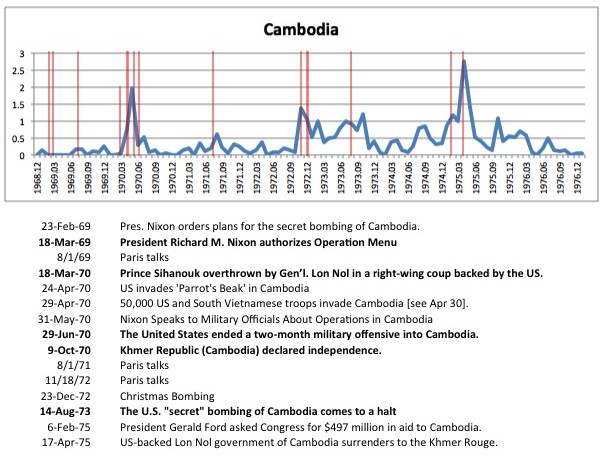
Detailed Timeline – Memcons ‘Le-Duc-Tho-Agreement’ Topic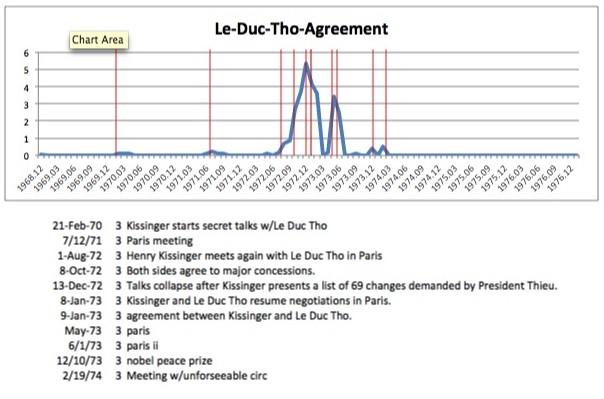
Additional Findings
