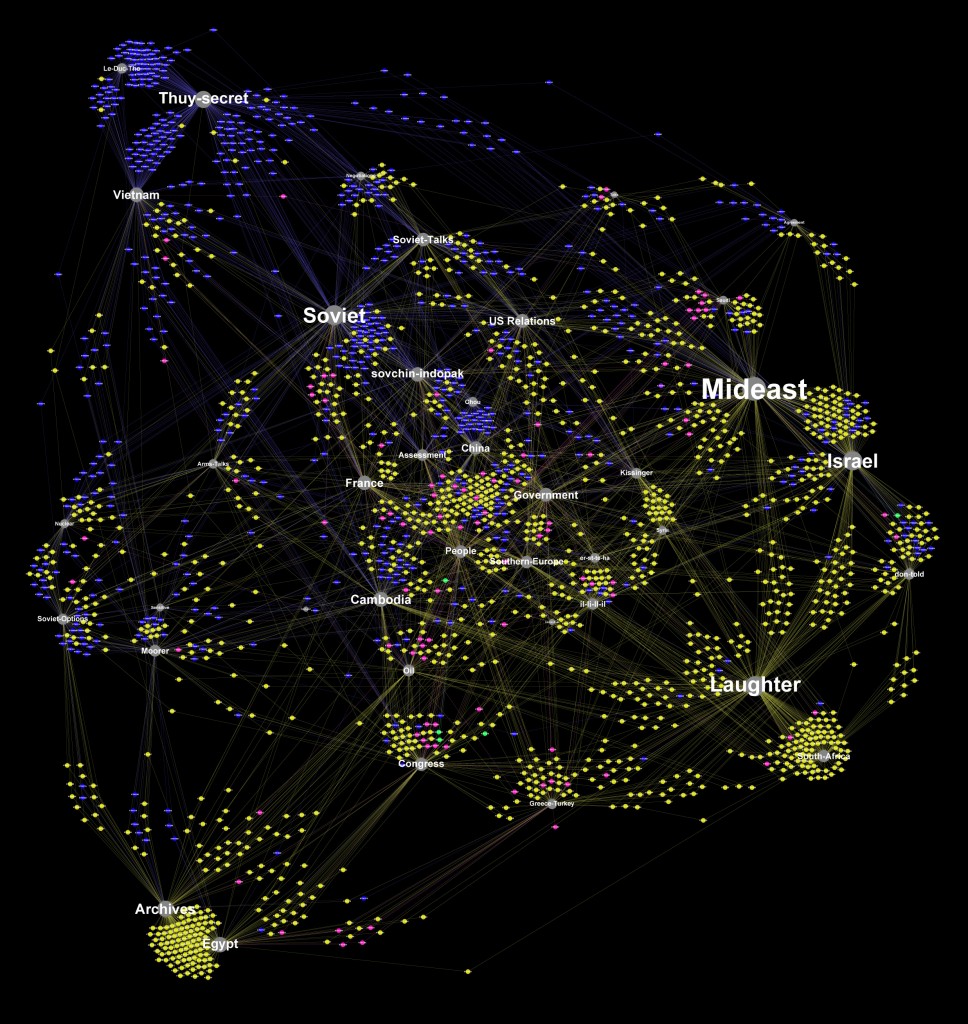
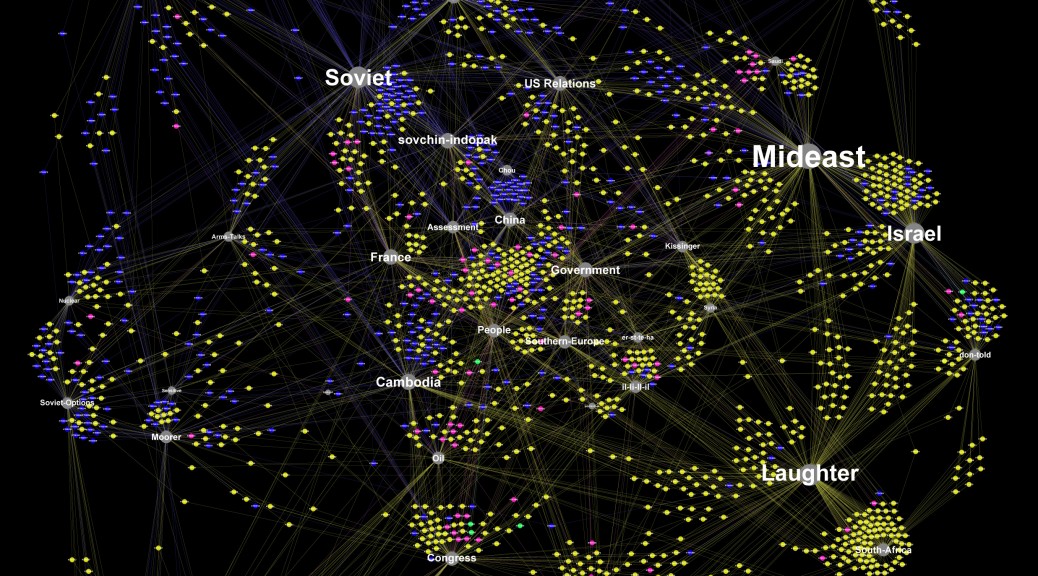
Instead of a more traditional x/y axis graph, each memcon in the archive and their relation to the 40 topics of the topic model are represented here using a ‘force-directed’ diagram. More than prior figures, this graph is off-putting at first and requires a bit of orientation to understand. Here each document is represented by one of a network of small circles, connected by lines and placed at a distance from the larger circles (the topics) according to their respective association to each topic. The size of the topic circles and their textual labels reflects the total weight afforded to them by the documents in the archive, and the color of the small documents’ circles and connecting lines reflects the classification status of each document.
Memcons: Static Topic Model Force Graph

This graph elegantly demonstrates in one view the interrelated ‘clusters’ of documents by proximity, their classification status, and the complex ways in which all documents relate to their constituent topic(s) and to one another. Even more than the line/area graphs, this image synthesizes the information gathered through metadata analysis, n-gram counting, and topic modeling to present inter-relationships not always readily apparent from a tabular view of the underlying data.
The blue dots/lines represent documents with ‘Top Secret’ classification status, the yellow dots are ‘Secret,’ the pink dots are ‘Unclassified’ and the 40 topics of the topic model are displayed as grey circles with text. Documents sharing similar topic weightings are clustered together, and placed at a relative distance from those topics. The placement of documents and topics related to matters of high military or national security significance among the bluish upper left region is unsurprising, as is the placement of ‘laughter’ so far on the other side of the graph. It is also notable that this upper left hand area of the graph contains those countries at the heart of Nixon and Kissinger’s vaunted “triangular diplomacy.” The topics concerning Soviet Union, China, Vietnam, and related topics are all placed in close proximity to one another occupying a close-knit area of the graph, suggesting that when those topics were mentioned they were often mentioned together. There is another fascinating topic in this topic model revealed by this graph, one with a unique significance. The “Laughter” topic is based upon those documents in which the transcriber literally placed the phrase “[laughter],” representing jovial, lighthearted moments of Kissinger’s correspondence in which the participants had a chuckle. A historian would expect these sorts of emotional expressions to occur in inverse proportion to the gravity of their respective topics (for example, the least ‘laughter’ during those negotiations in which relations were at their most sensitive, tense and/or adversarial), and the placement of the “Laughter” topic at the furthest possible point from topics relating to the Soviet Union, China and Vietnam negotiations validates this interpretation.
