A Computational Analysis of the National Security Archive’s Kissinger Collection Memcons and Telcons
By Micki Kaufman,
doctoral student in US History
at the Graduate Center of the City University of New York
Quantifying Kissinger – Intro Video 7/14/2014 from Micki Kaufman on Vimeo.
On December 18 1975, in a meeting with senior staff, Secretary of State Henry Kissinger decided to ‘raise a little hell’. He was furious with what he called their ‘incomprehensible’ decision to include sensitive information in a diplomatic cable.
“I want to raise a little bit of hell about the Department’s conduct in my absence. Until last week I thought we had a disciplined group; now we’ve gone to pieces completely. Take this cable on East Timor. You know my attitude and anyone who knows my position as you do must know that I would not have approved it. The only consequence is to put yourself on record. […] What possible explanation is there for it? I had told you to stop it quietly. I didn’t say you couldn’t make a recommendation orally. […] It is incomprehensible. It is wrong in substance and in procedure. It is a disgrace.”
Kissinger then went on to complain that the cable would undoubtedly leak:
“It will go to Congress too and then we will have hearings on it. [That will] leak in three months and it will come out that Kissinger overruled his pristine bureaucrats and violated the law. […] You have a responsibility to recognize that we are living in a revolutionary situation. Everything on paper will be used against me.”
— ‘The secret life of Henry Kissinger; minutes of a 1975 meeting with Lawrence Eagleburger’ by Mark Hertsgaard, The Nation, October 29, 1990.
About the Project
Scarcity of information is a common frustration for historians. This is especially true for researchers of antiquity, but not exclusively so. For students of twentieth- and twenty-first century history the opposite problem is also increasingly common — overwhelmed instead by a deluge of information and confronted by a vast field of haystacks within which they must locate the needles (and presumably, use them to knit together a valid historical interpretation), historians have already struggled with what is now understood as ‘big data’.
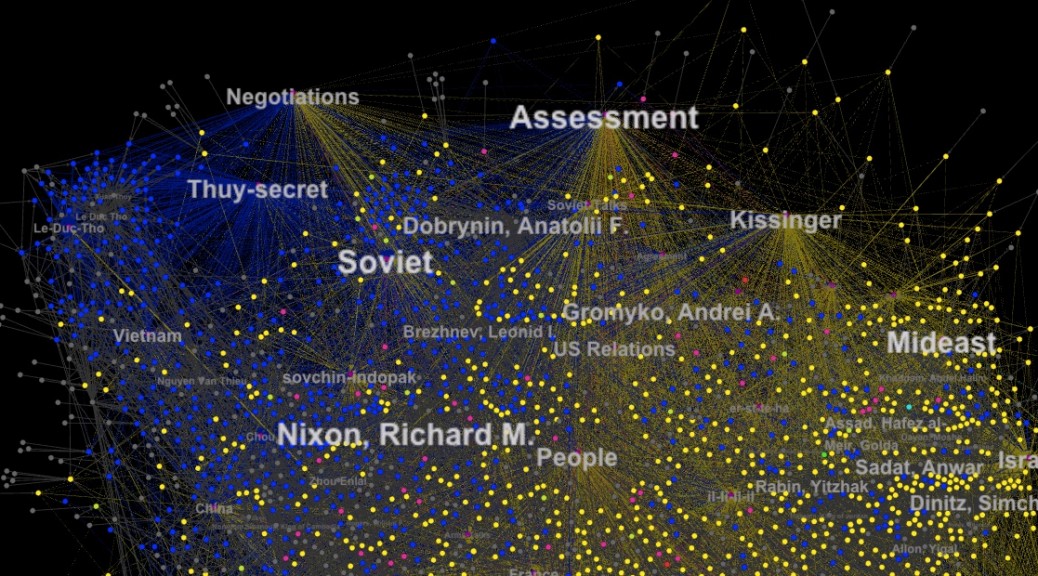
Exhaustive efforts by historians at approaching vast troves of information have often employed a traditional ‘close-reading’ methodology in which each author’s thesis is illustrated by hand-picked, ostensibly representative samples, presented as valid proof of the underlying argument. Ensuring such examples are indeed representative for historical interpretation is increasingly difficult as the size of the archive increases. As larger and larger archives of human cultural output are accumulated, historians are beginning to employ other tools and methods — including those developed in other fields, including computational biology and linguistics — to overcome ‘information overload’ and facilitate new historical interpretations. This project is an application of ‘big data’ computational text analysis techniques to research the Digital National Security Archive (DNSA)’s recently released Kissinger Collections, comprising approximately 17500 meeting memoranda (‘memcons’) and teleconference transcripts (‘telcons’) detailing Kissinger’s correspondence during the period 1969-1977: it is a first effort at ‘Diplonomics’.
The declassification of the Kissinger material by the State Department and the hosting of that material on the DNSA’s Kissinger Collection web site therefore presents an opportunity and a challenge for historians. While having this large volume of information online for researchers is valuable, the restriction to a web-based ‘search’ interface can render it of limited use to researchers. The application of more sophisticated computational techniques permits a comprehensive analysis of the historical records of the Kissinger collection at the DNSA, and facilitates meaningful historical interpretations. While this new way of looking at history is based on data, unlike other methods of historical analysis (eg ‘cliometrics’) it is the variations of the content of the text itself, rather than economic data, that is measured.
To read the research findings, use the menu at the left or the bottom of the page to view ‘all posts‘ or drill down into a page specific to the method or visualization that interests you.
