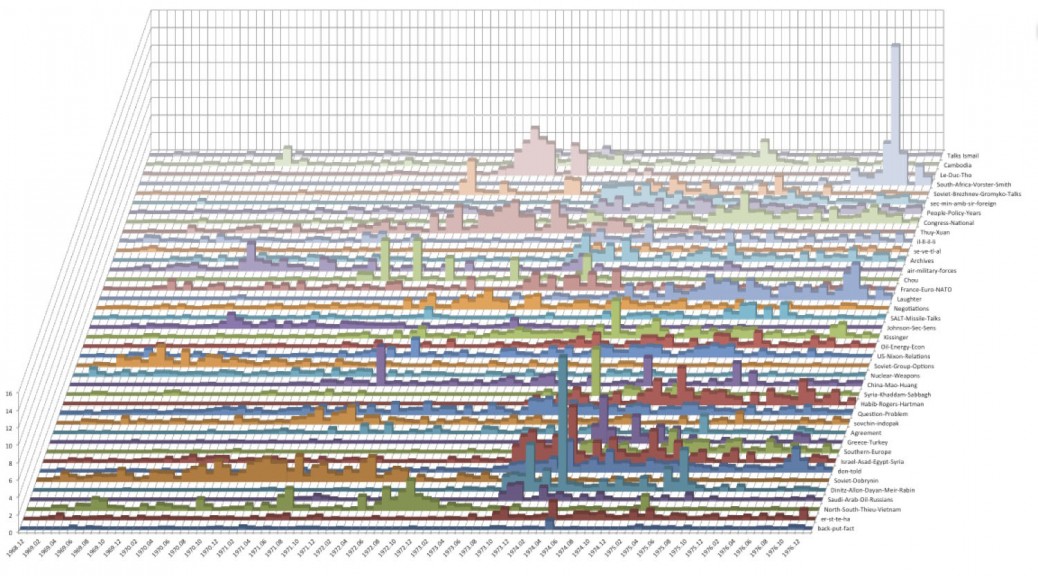
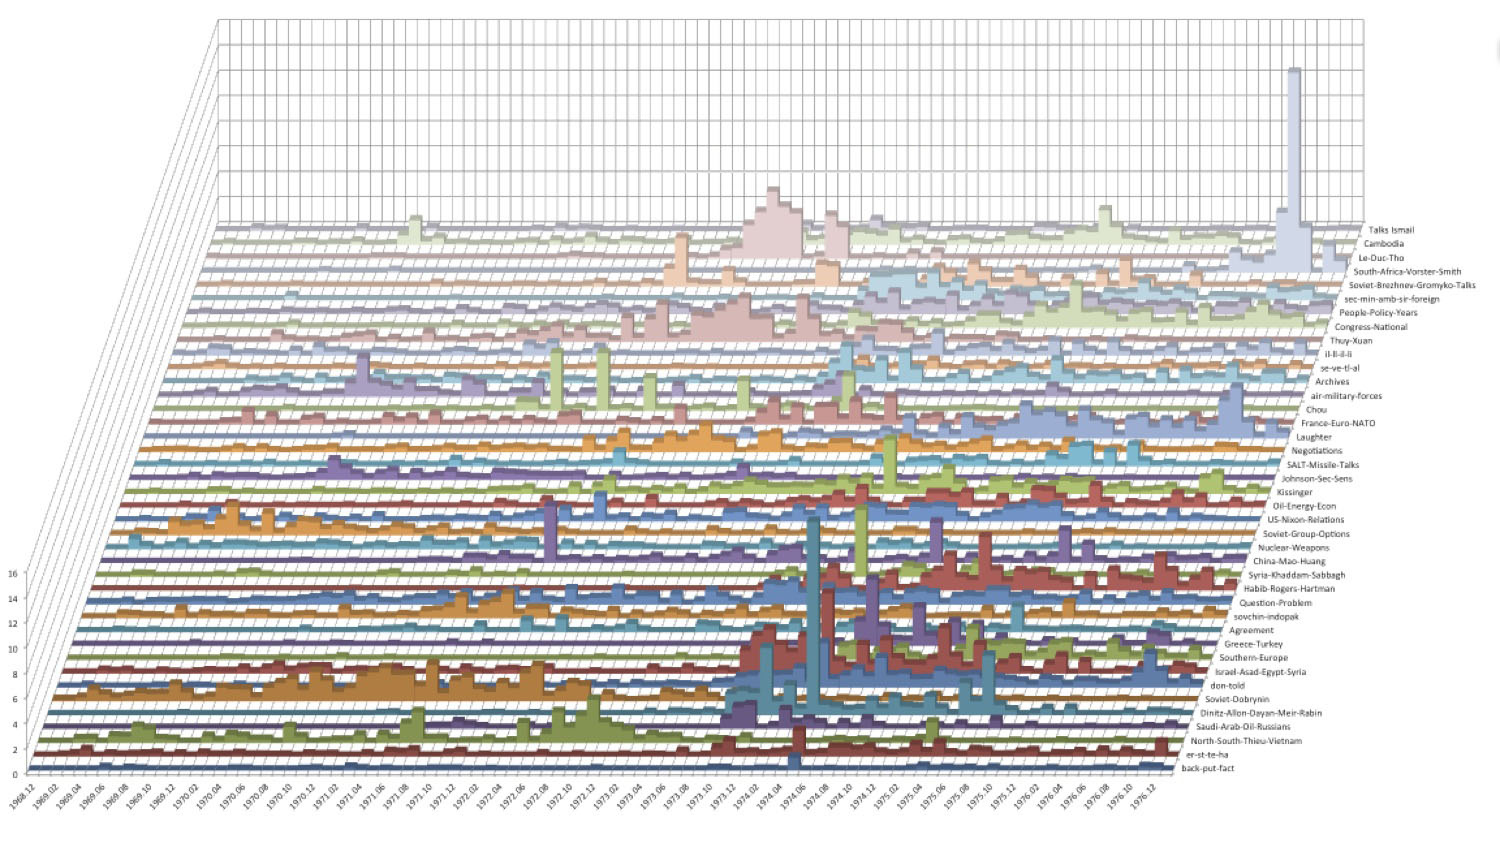
These graphs show the topic models for the memcons and telcons. Like the Stream Graphs, they display the striking change in density between the periods before and after Kissinger’s promotion to Secretary of State, as well as thought-provoking parallels between the topics themselves.
Category Archives: Line and Bar Graphs

Sentiment Analysis Line Graphs
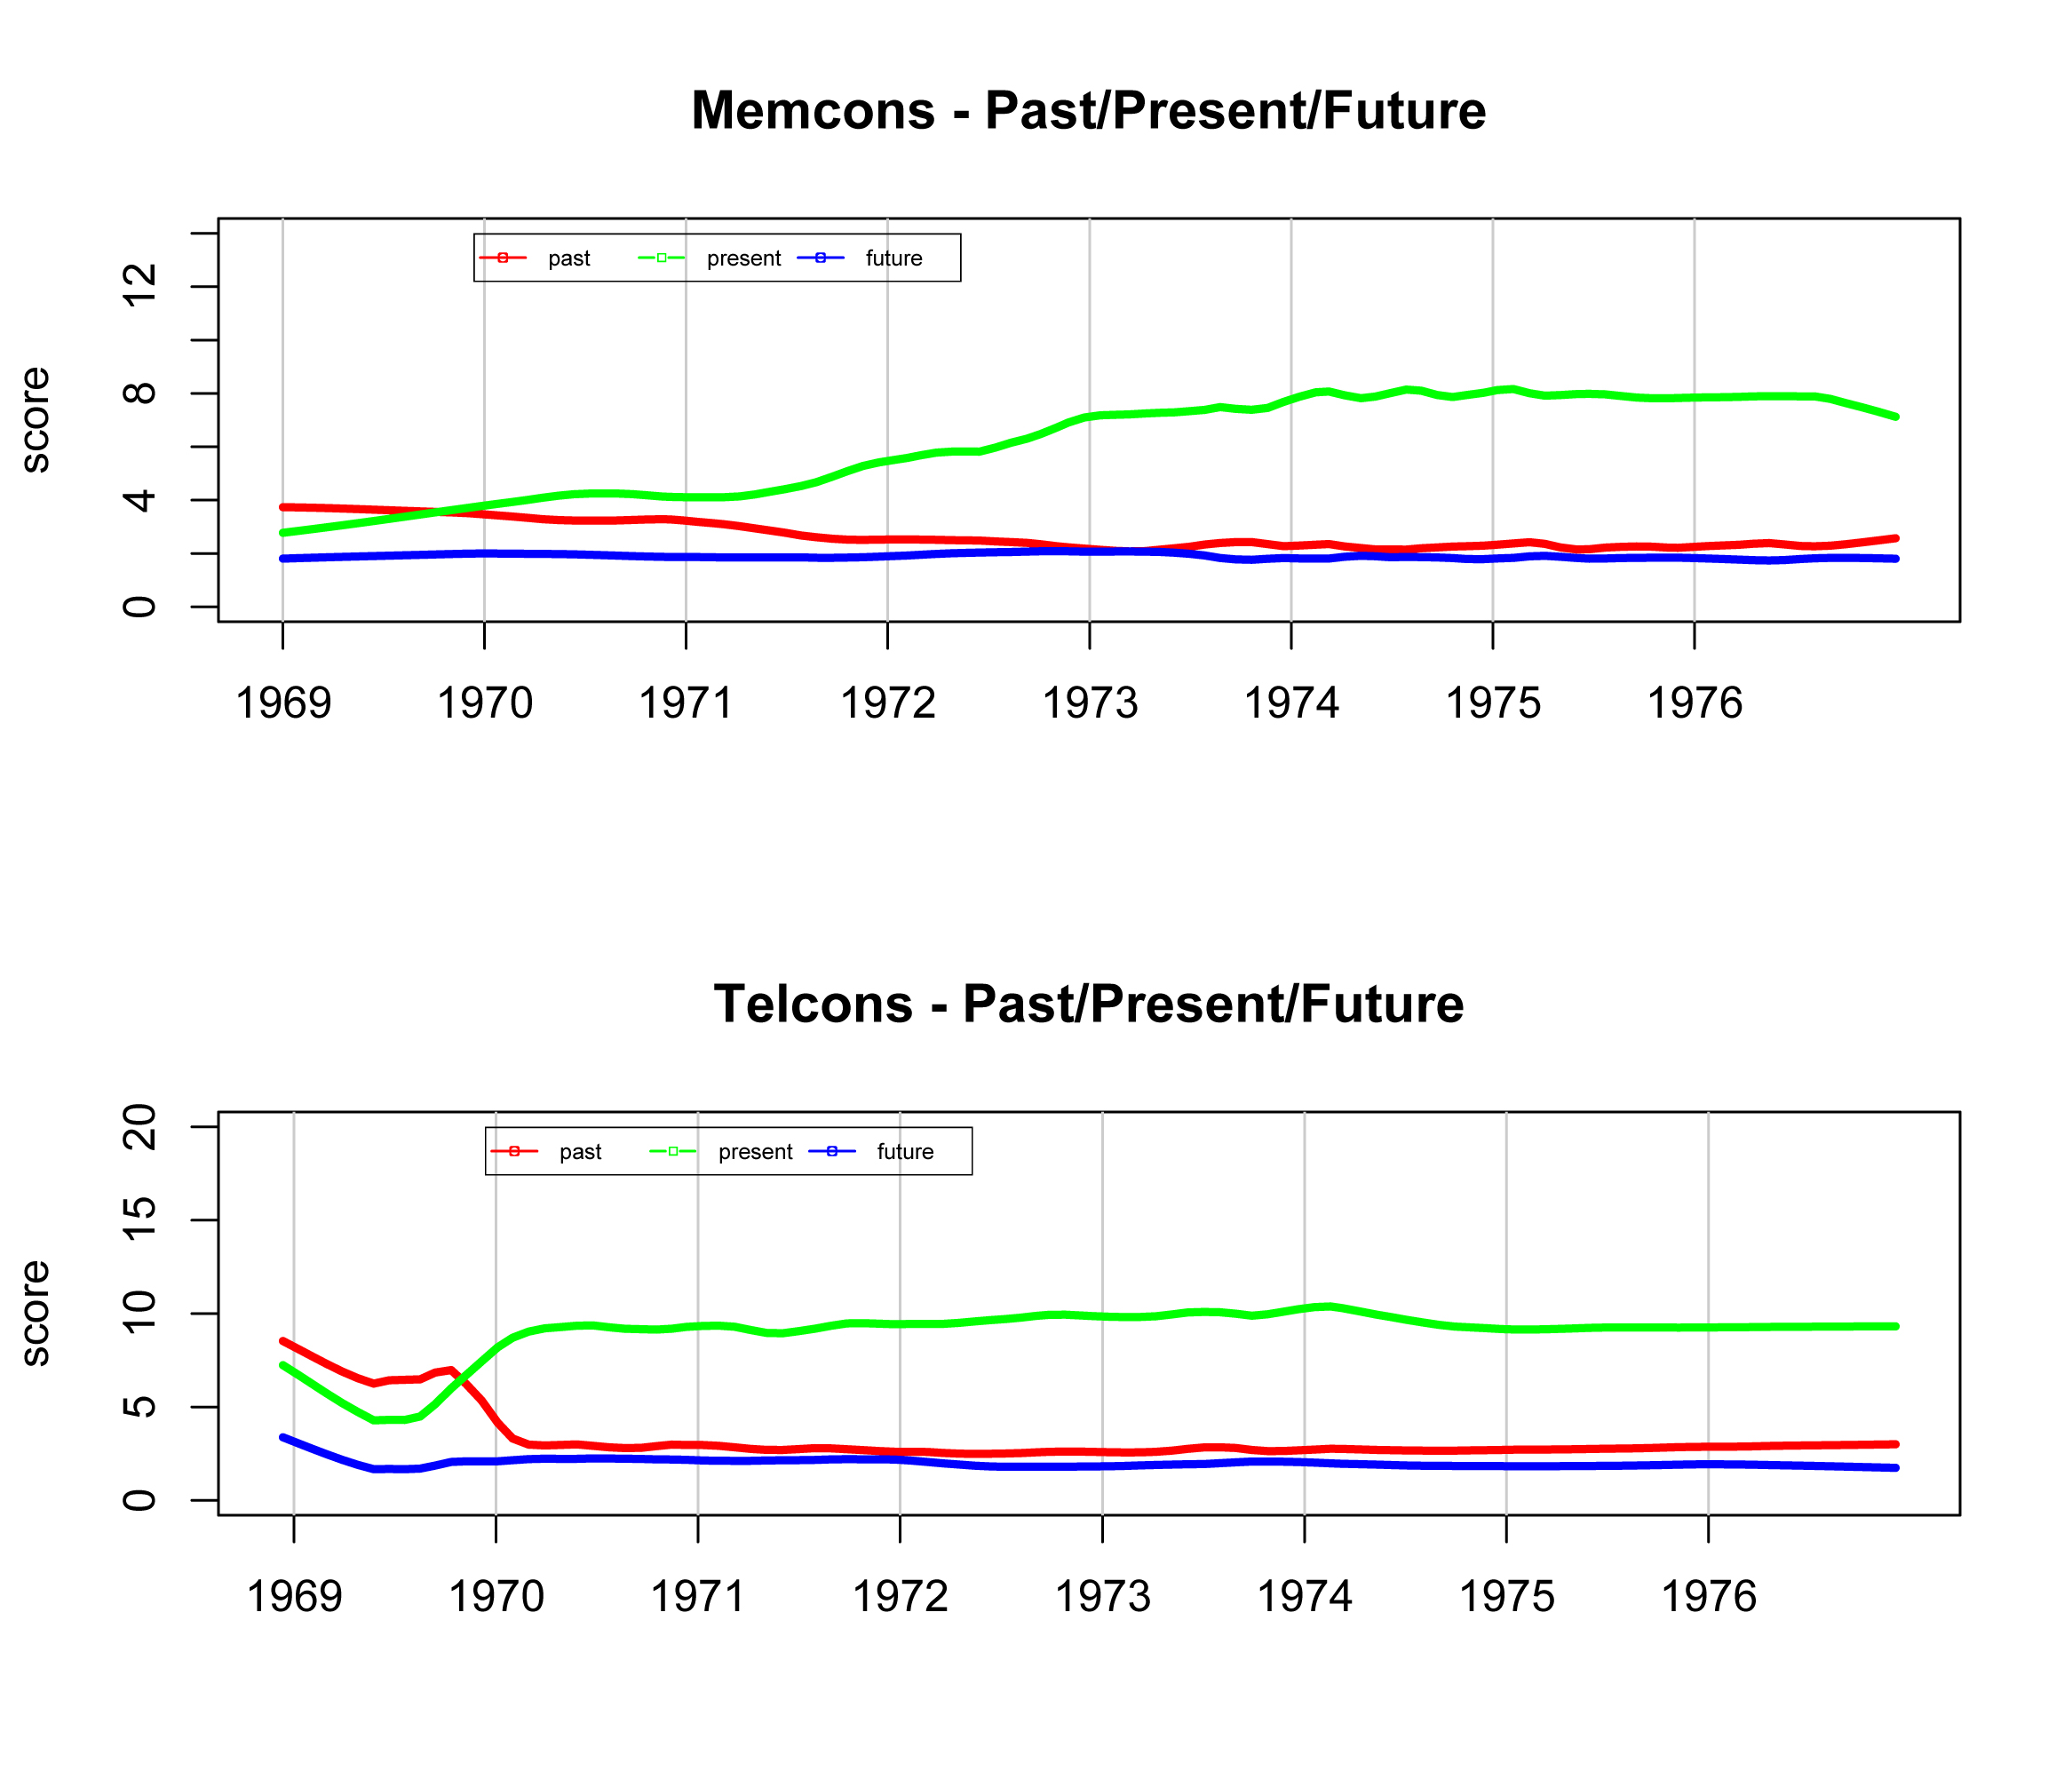
‘Past/Present/Future’
In these two graphs the percentage of past, present and future tense is displayed. Despite the reputation Kissinger maintains as a forward-looking diplomatic master, it was in fact the past tense that predominated in language at the beginning of the administration in both forms of correspondence, Later, ‘present tense’ became more prevalent, with the crossover happening nearly simultaneously at the end of 1969 in both forms of correspondence. At no time did the use of ‘future tense’ predominate.
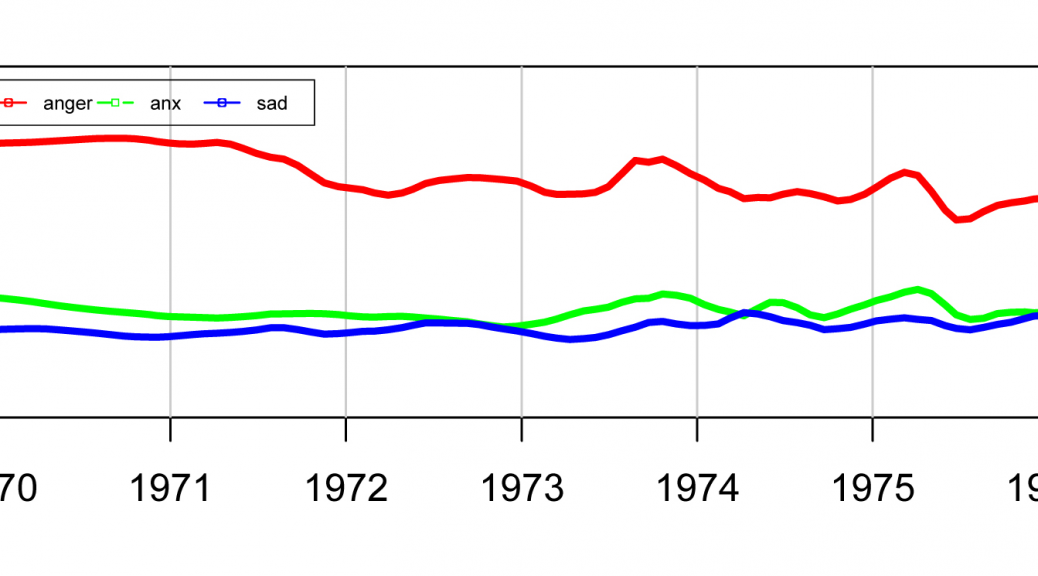
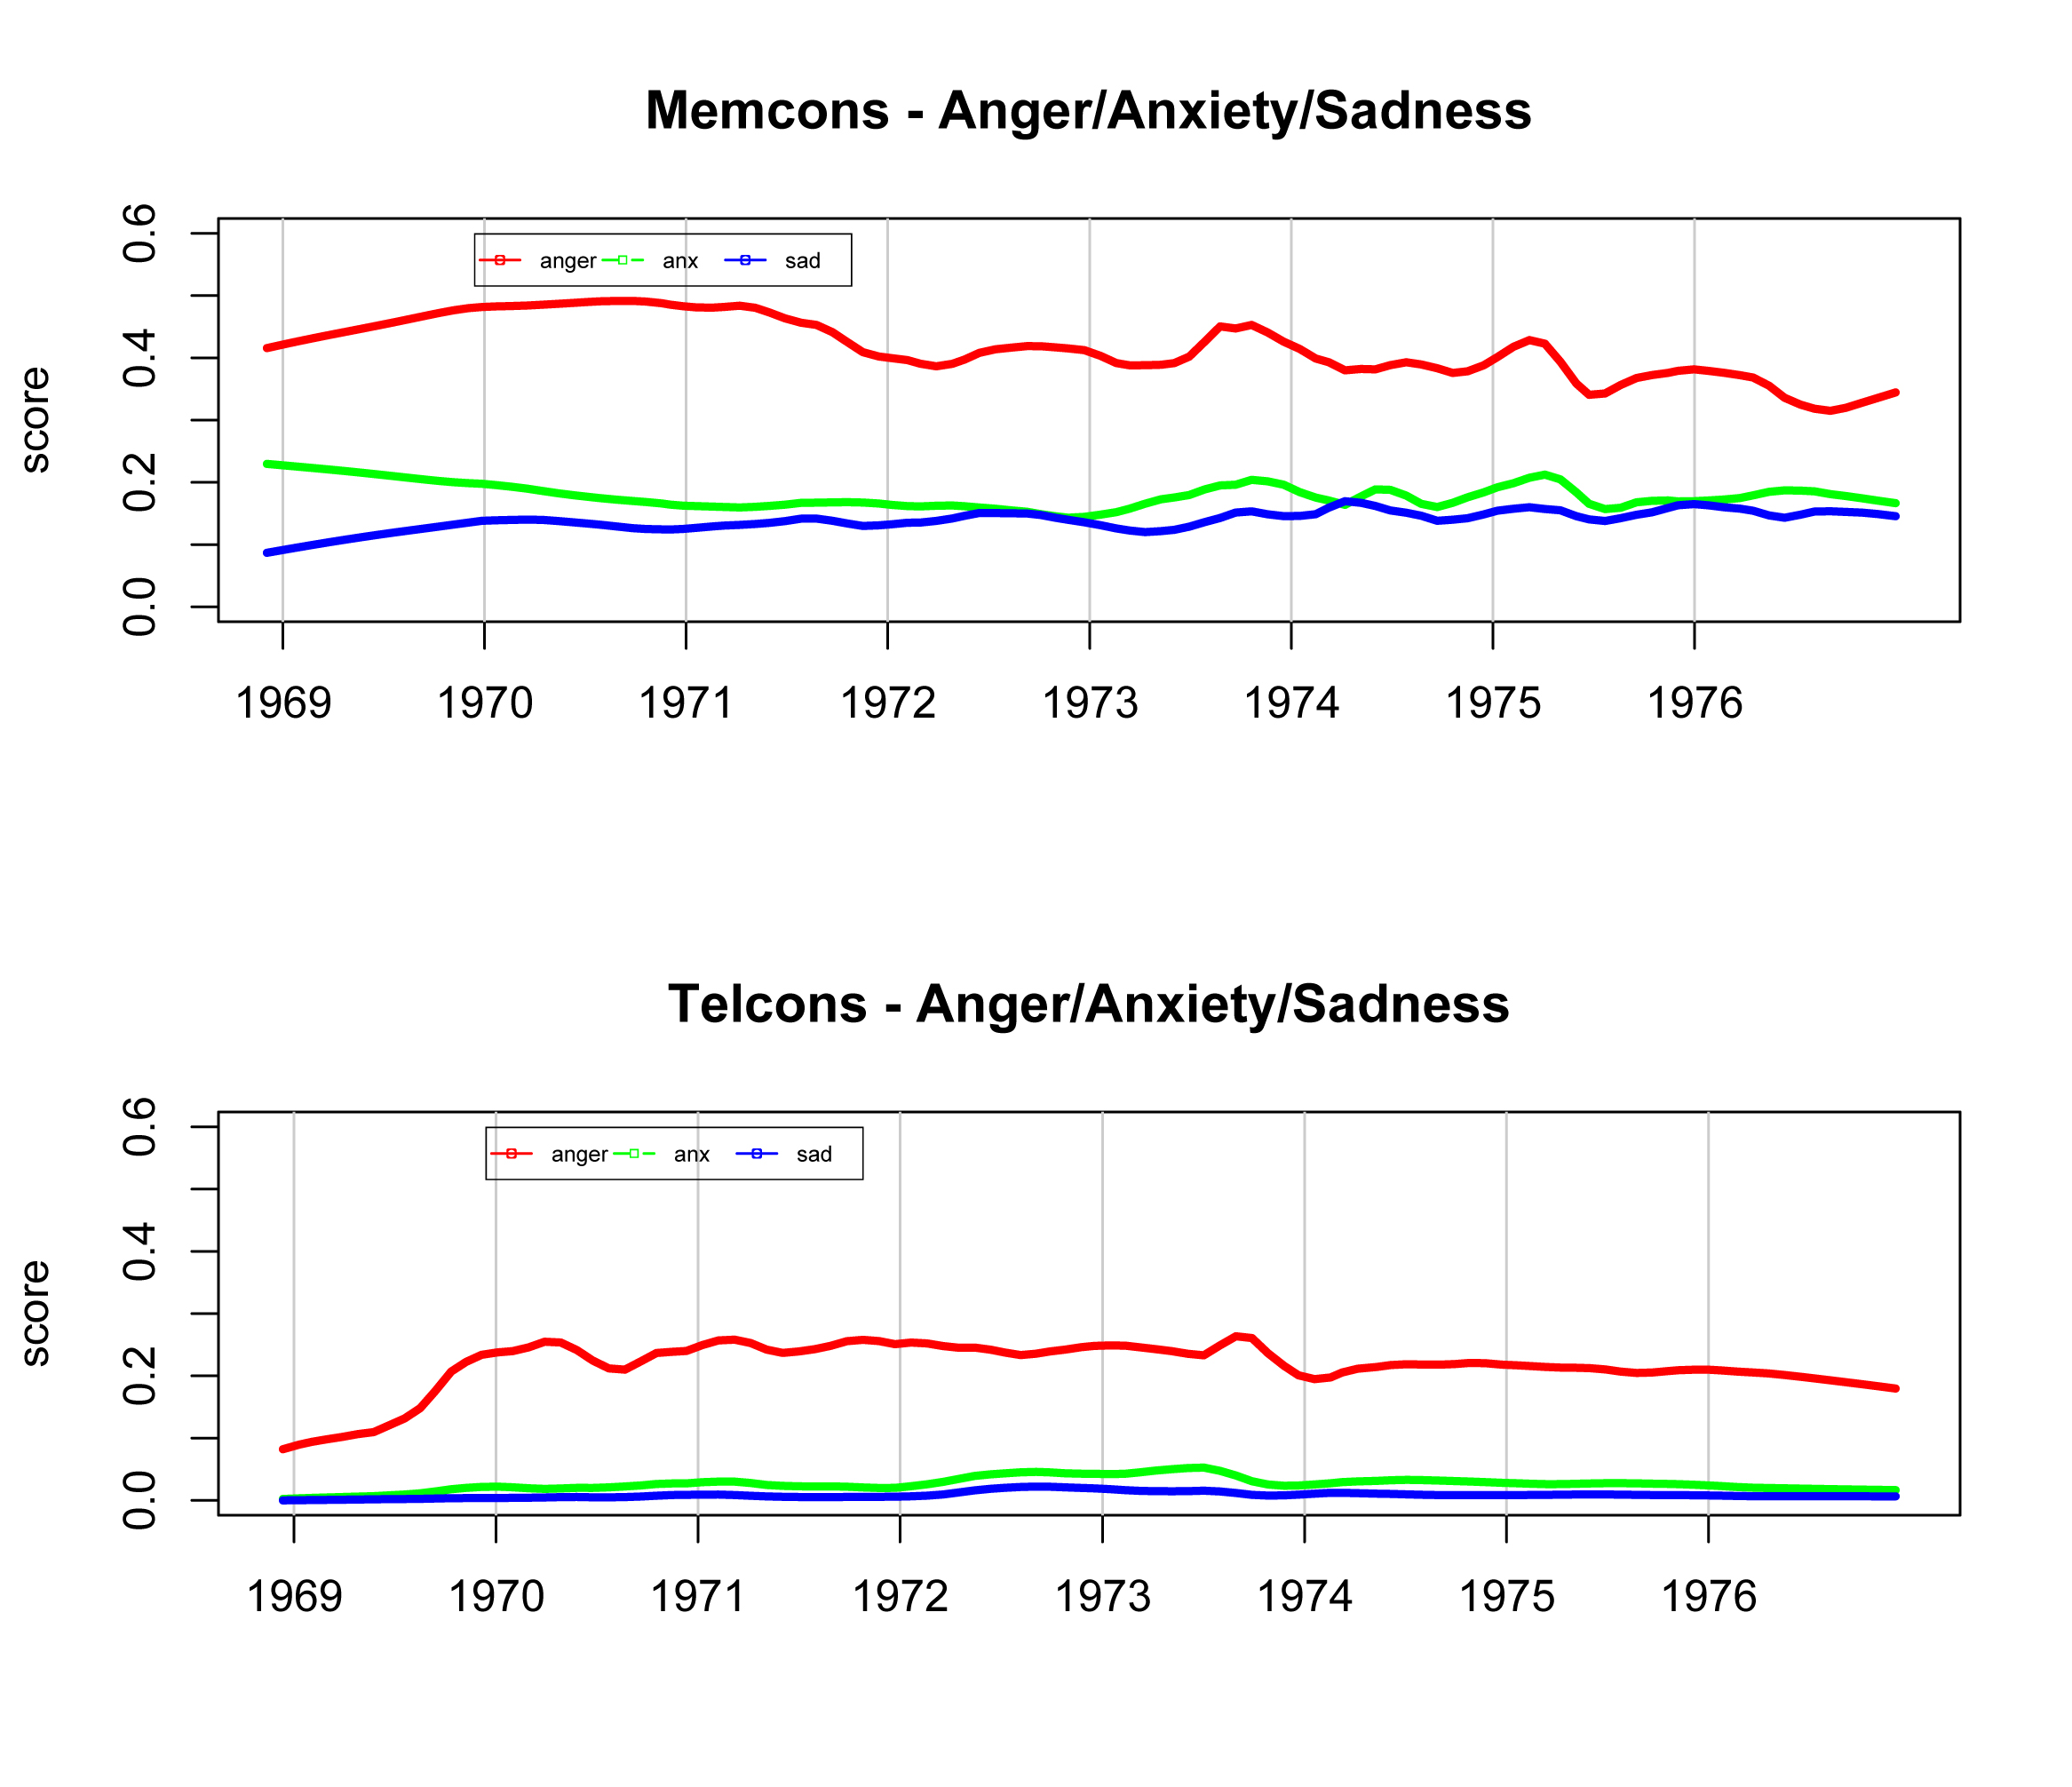
‘Anger/Anxiety/Sadness’
In these two graphs the levels of ‘anger’, ‘anxiety’ and ‘sadness’ are displayed. Notably, the level of ‘anger’ reached a simultaneous peak in both correspondences during the latter quarter of 1973 as Watergate loomed, Vice President Spiro Agnew resigned and the “Saturday Night Massacre” resulted in the resignation of Elliot Richardson, unwilling to fire special prosecutor Archibald Cox. There are a few other peaks of ‘anger words’ visible in the meeting memoranda, one occurring in late 1975 at the time of the fall of Saigon and Phnom Penh as well as a slow swell occurring from 1969-1972.
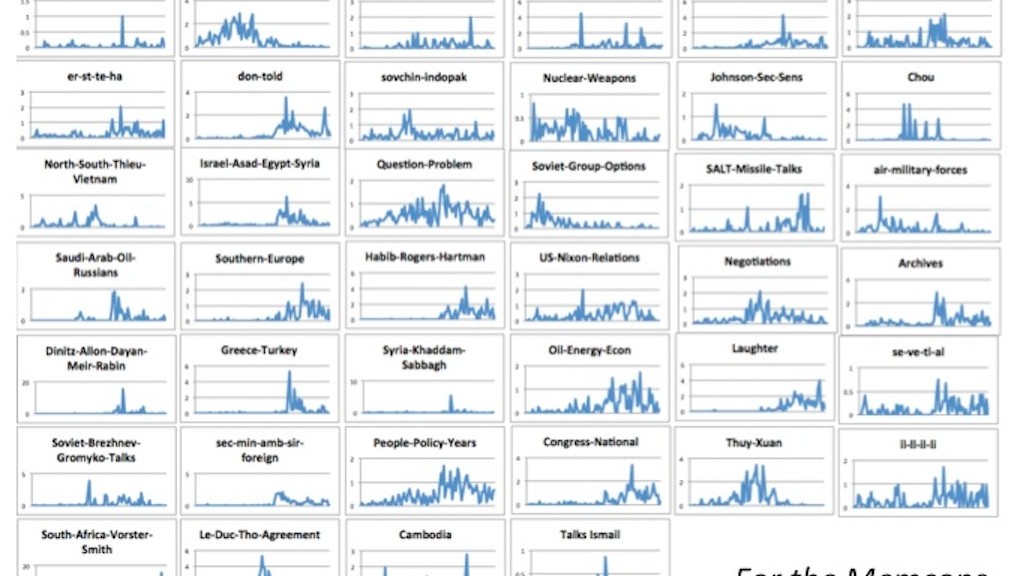
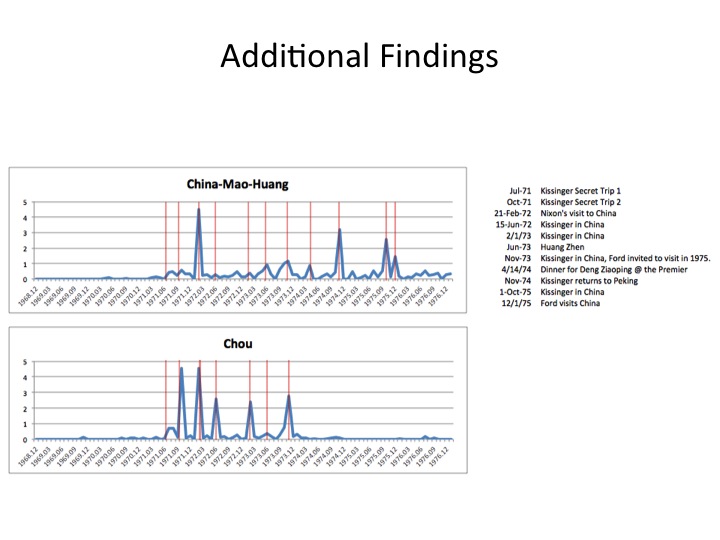
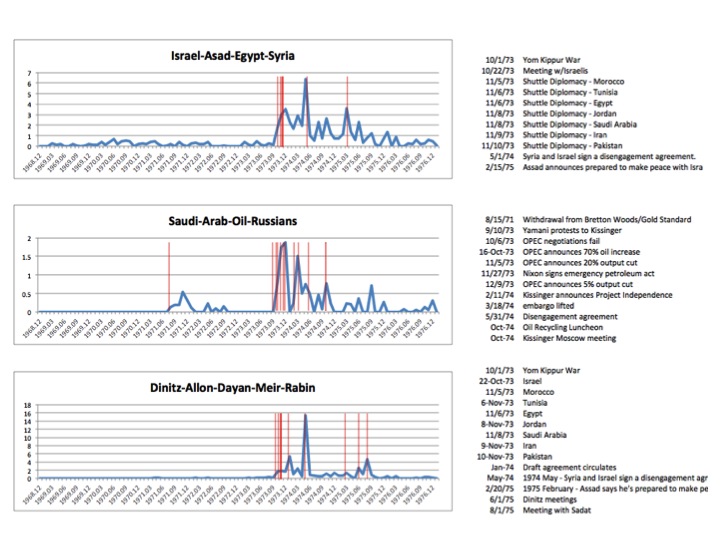
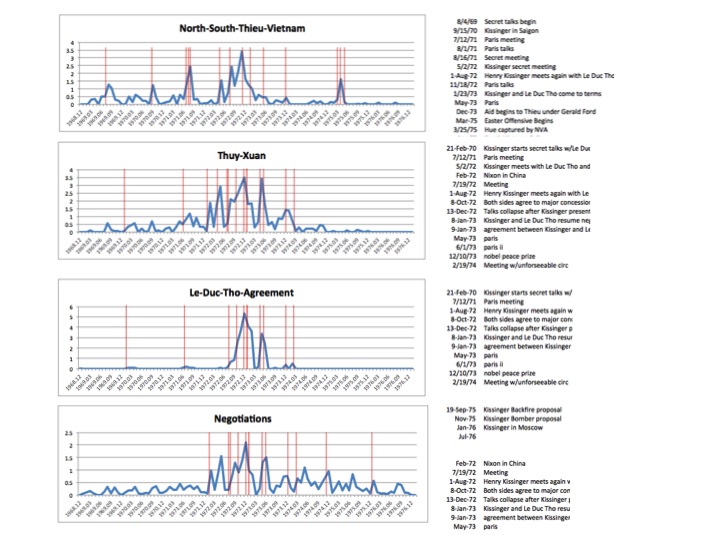
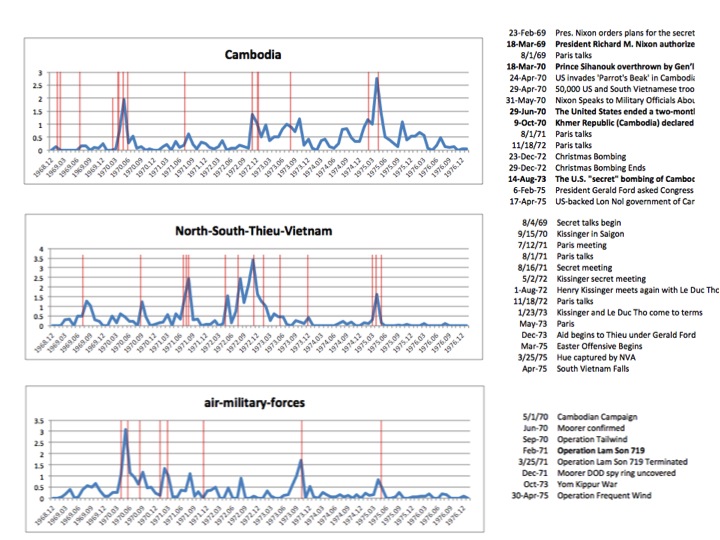
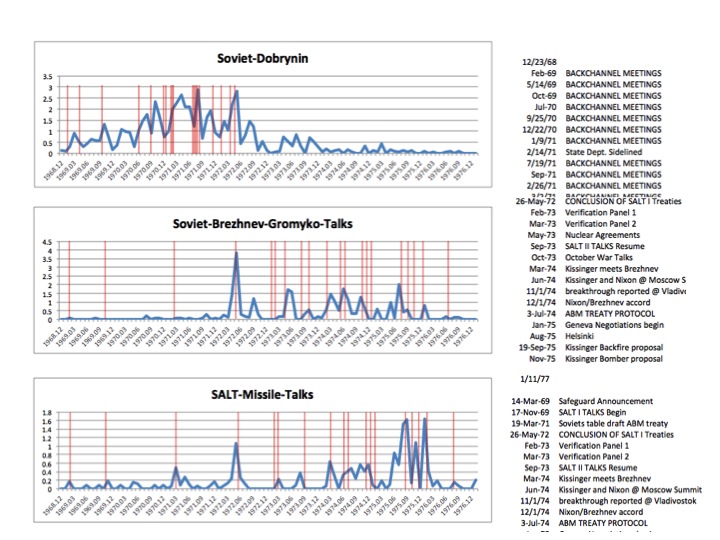
Topic Model Line Graphs
These graph thumbnails and closeups detail the topic weighting for a specific topic of the 40 topics in the topic model, each laid out on a timeline. The red lines represent selected historical events (listed in the sidebar to the right of the graph) displayed on the timeline for comparison to the changing topic data.
Memcons Topic Model Thumbnails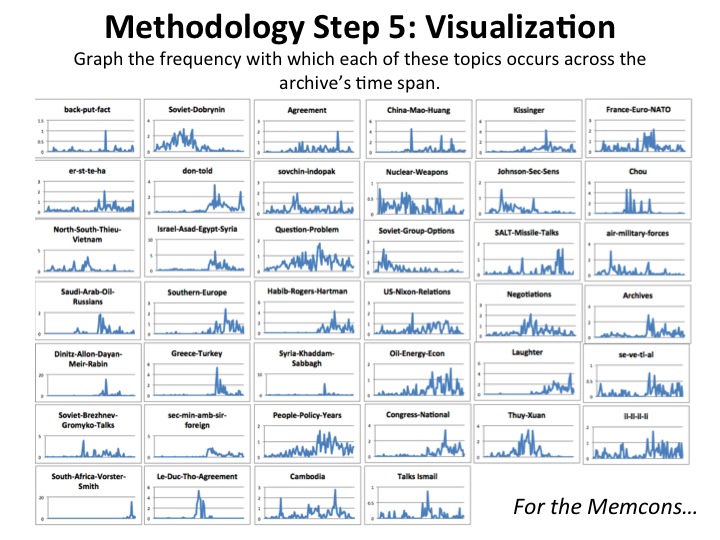
Telcons Topic Model Thumbnails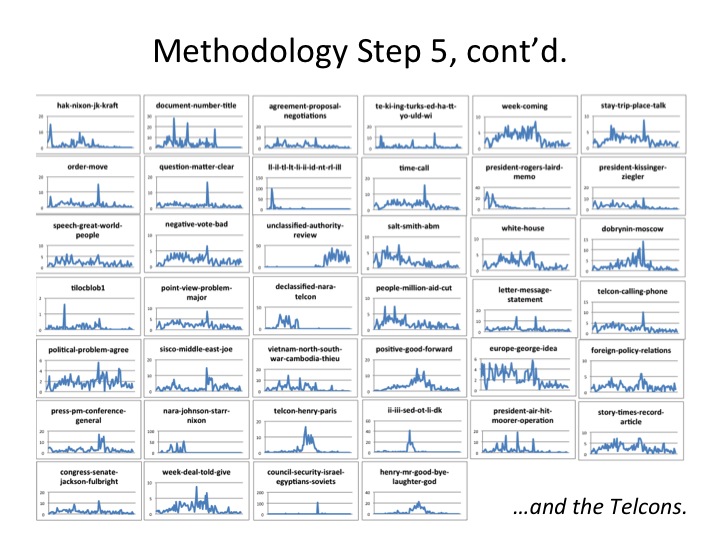
Detailed Timeline – Memcons ‘Cambodia’ Topic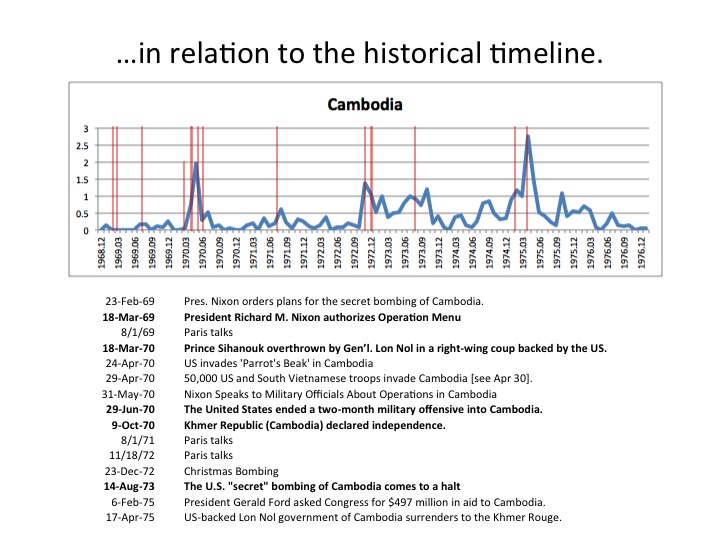
Detailed Timeline – Memcons ‘Le-Duc-Tho-Agreement’ Topic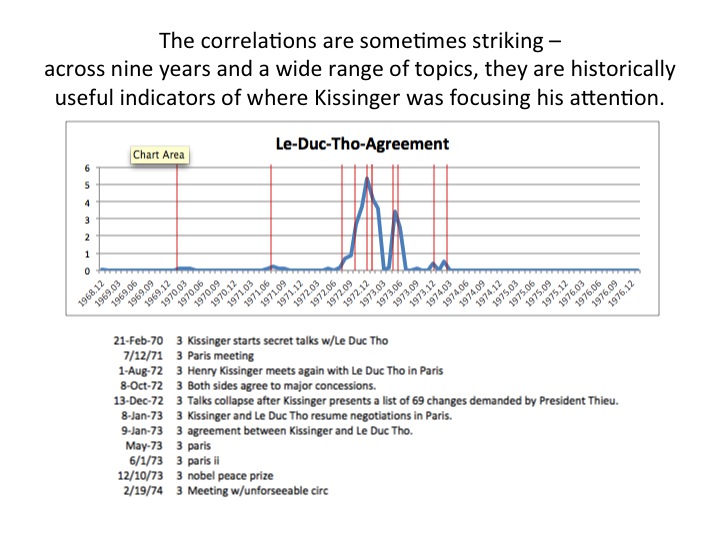
Additional Findings