Static ‘Textplot’ of both corpora
This is a network of the 1300 most frequent words in each corpus, related according to their mutual similarity in probability distributions across the span 1969-1977. This was accomplished using the fabulous ‘textplot‘ software, written by David McClure.
In both cases, the general time axis is left-to-right (the layouts were rotated in gephi after the gml files were generated, and then those gephi-generated files were run through the ‘kissinger’ branch of the software found at the humanist github repository.
In the memcons, the ‘tendrils of specificity’ (the long patterns of increasingly specific words emerging like pseudopods in similarly-colored Modularity Classes from each diagram’s center) relate quite distinctly to areas of geopolitical focus, such as the Soviet Union, Japan, China, the Middle East, and Vietnam, among others.
Memcons ‘Textplot’
In the Telcons textplot, the ‘tendrils’ are most closely related to what appear to be large swaths of the telcons bearing the varying stamps marking the documents’ former classification and declassification statuses:
There are also some clusters that appear to be based around geopolitical topics (those related to Vietnam, for example). Also noteworthy are: 1., a grouping that appears related to a section of the documentation with increased OCR error rates or other improperly converted material (this grouping may also reflect the use of initials in the transcripts, although it’s unclear at this time to what degree.) and 2., the placement of the first names of Kissinger’s wife Nancy and son David, distinctly outside the general word networks.
Telcons ‘Textplot’
It’s important to note that while there are certainly similarities between the nodes comprising the various ‘tendrils of specificity’, textplot’s similarity calculation is based on a calculation of word frequency across the corpus as a whole, without distinction at the document level. This can result in contrasting results to collocation, topic modeling and other analyses that can operate at the document or ‘chunk’ level, and the difference can be instructive in some cases.
For example, the presence of ‘bombing’ is among the most frequent 1300 words in the telcons, nestled tightly within the cluster of words related to Vietnam. The word does not appear among the most frequent in the memcons. Given the differences in word composition between the two corpora (familiarity, % of nouns/place names, formailty, detail, provenance, redaction, etc.), this is to be expected, but nevertheless the word’s presence is still interesting for a few reasons.
Zoomed-in on ‘bombing’ within the
Vietnam-related cluster of telcons document 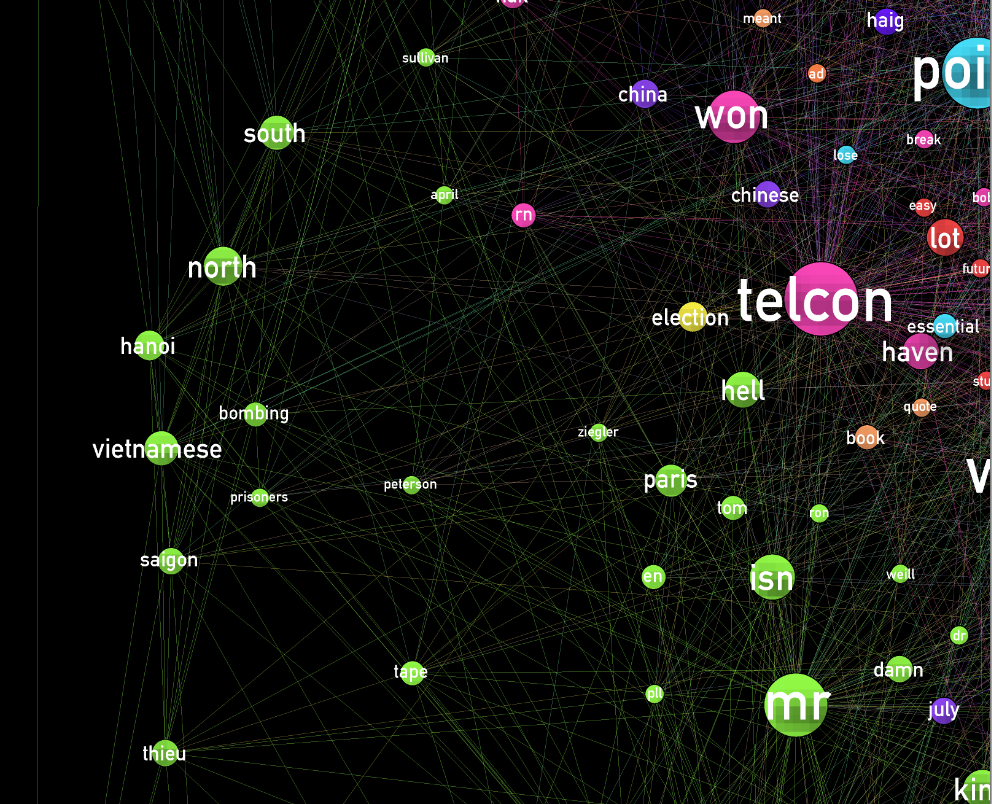
Among a number of possible reasons, the finding is interesting because coming as a recent finding (2014-2015) it is a non-linear ‘post-indication’ of the value of the earlier decision (2012-2013) to do collocation analysis using bombing as the target word. This is especially true given the resulting finding that indicates a potentially significant distribution in the collocation MI-scores between ‘bombing’ and those words describing Vietnam, versus those that describe the country’s neighbors in Indochina.
A recent finding providing possible insight regarding an earlier, intuitive research decision, it strikes me that this is a poweful, non-linear example of the value of visualization as an ongoing process, rather than a one-time production process that results in a specific finding. Additionally, this makes me ponder about cases where the reasons for one’s instincts and biases (in my case, the selection of ‘bombing’ as a target word) may sometimes be seen in the data.
Interactive Textplots
David’s ‘humanist‘ software was then used to create an interactive d3-based browser based on the textplot output gml for each corpus. Without Modularity Class coloring of the nodes, this ‘alpha’ interactive version is (also for the moment) less able to communicate the groups within the distribution of words than the static diagrams.
Kissinger Interactive Textplot (Telcons)
Kissinger Interactive Textplot (Memcons)
2 thoughts on “Force-Directed Diagram: Memcons and Telcons ‘Textplot’”