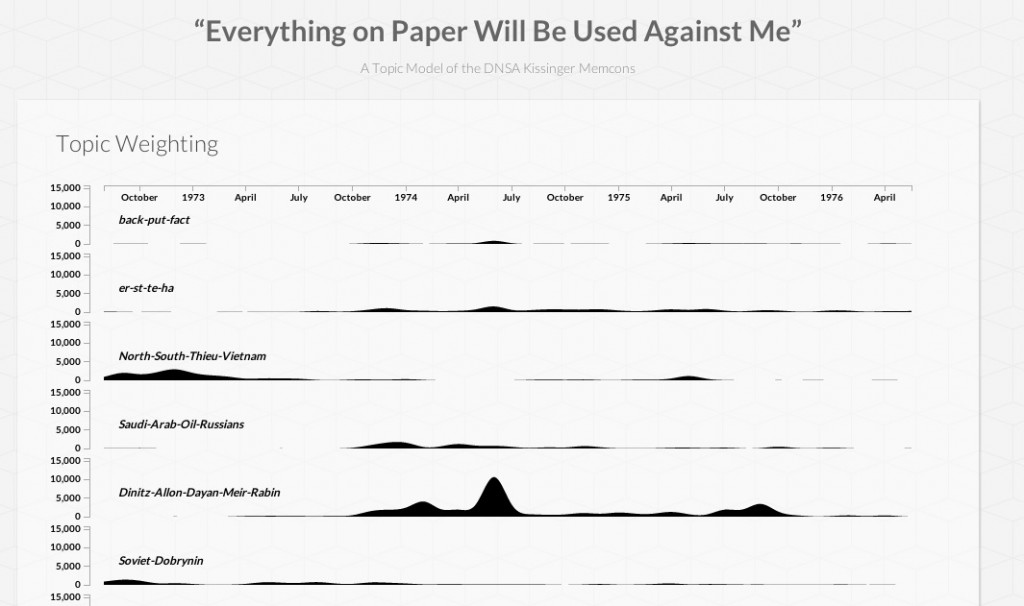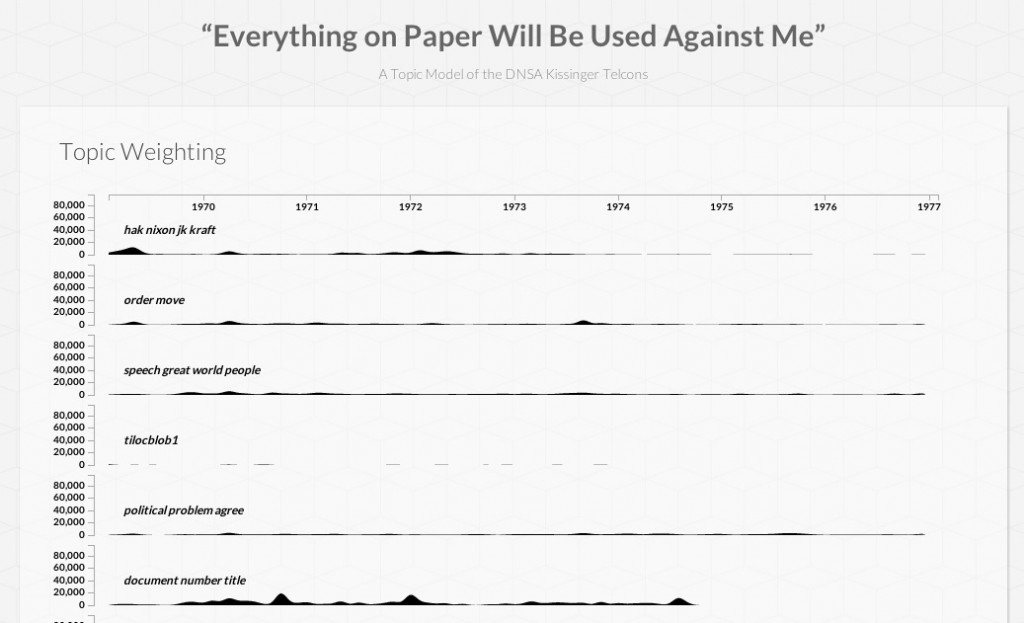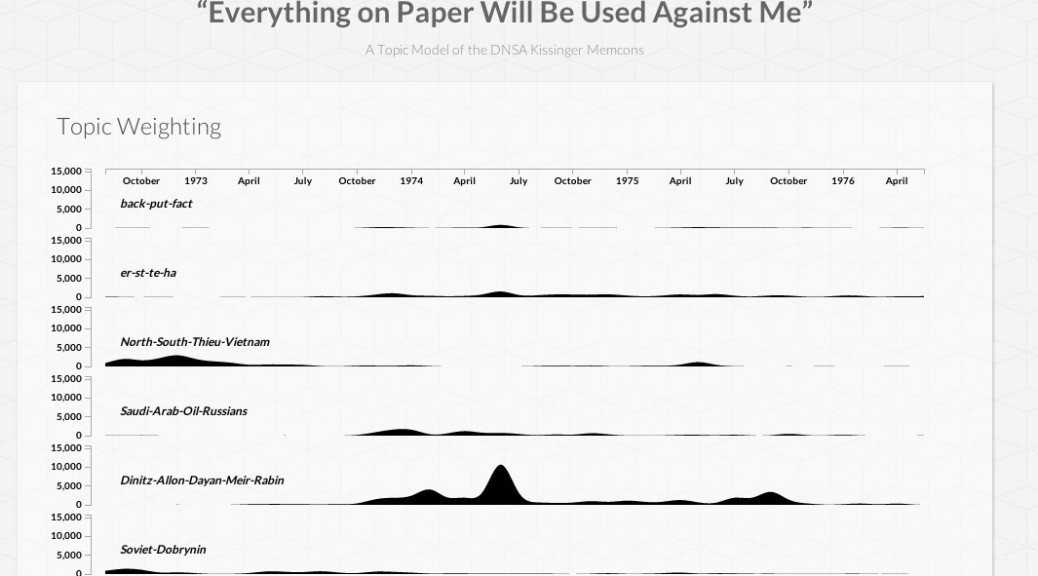
The capability to go beyond merely counting word frequency to measuring the correlations in frequency between words is a powerful tool for computational historical research. This technique, called ‘topic modeling,’ relies upon complex probabilistic mathematics beyond the capabilities of most historians. Using a variant of MALLET (open-source topic modeling software), I have assembled topic models of the Kissinger collections. The initial results of this process resulted in a 40-category list for both the memcons and telcons collections. By compiling the topic modeling data and graphing each topic’s frequency data into an x/y line/area graph, a contextual, historical timeline emerges for each of the 40 Kissinger memcon and telcon topics. Peaks in the graphs indicate the dates of documents that contain the highest cumulative ‘weighting,’ or relevance, to that respective topic. Immediately, the data graphed on the timeline evokes questions: many of the peaks on the topic graphs synchronize well with related events in the historical record. Examining each topic graph in relation to these historical timelines is in itself a useful exercise for researchers in finding content related to a particular topic.
For example, those interested in reading documents most closely associated with the wars in Indochina and Kissinger’s Paris Peace Conference talks with Le Duc Tho and Xuan Thuy, Chairman Mao and Chou En-lai, the Cambodia Campaign and resulting public outcry in May 1970, the ‘Backchannel’ and SALT talks with Dobrynin, Gromyko, Brezhnev, or other topic areas of Kissinger’s activity can use these graphs to locate the relevant dates and documentation for their topics much more easily than by consulting a traditional index.